Introduction
In most IR offices, benchmarking isn't a proactive initiative. It's triggered by meetings. A provost preparing a board presentation, a dean checking whether faculty headcount is competitive, an accreditation visit that requires comparative data. The question is almost always the same:
“"How do we compare?"”
Across 50 interviews with IR directors and analysts at U.S. institutions — spanning community colleges, regional universities, and research institutions — benchmarking consistently emerged as one of the most common analytical responsibilities IR teams carry. It cuts across virtually every domain: student outcomes, faculty staffing, operational policy, program viability, and long-term institutional trajectory. Those same interviews, spanning 19 states, form the basis of our whitepaper on data request workflows; this post focuses on the benchmarking patterns within them.
- Provide strategic context to leadership navigating competitive and regulatory pressures
- Justify decisions with external validation rather than internal instinct alone
- Support accreditation narratives, budget modeling, and multi-year institutional planning
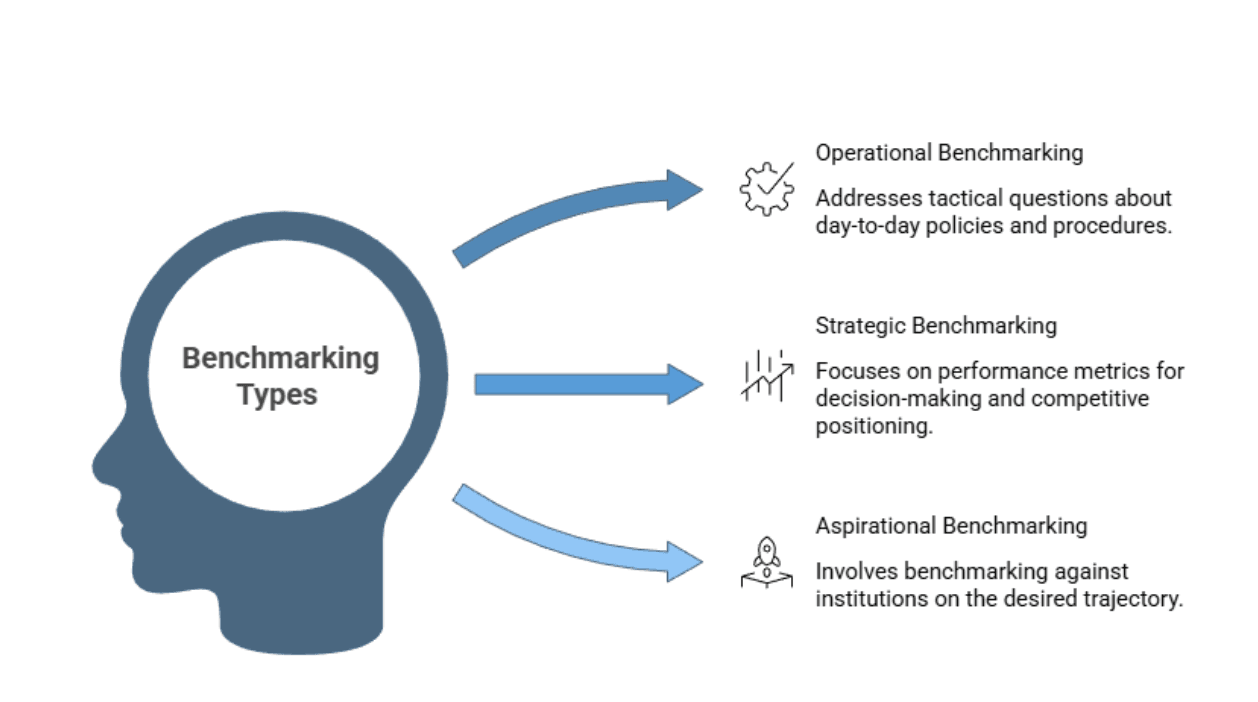
Three Types of Benchmarking
Operational Benchmarking
Day-to-day policy and procedure comparisons
Operational benchmarking addresses tactical questions about institutional policies and procedures — parking tiers, freshman car policies, number of commencement ceremonies, financial aid discount rates. This is typically fast-turnaround, decision-support work. It reduces risk by providing external validation before administrative decisions are made.
- Stakeholders: Cabinet members, operational leaders, department heads
Strategic Benchmarking
Performance metrics for decision-making and competitive positioning
Strategic benchmarking tracks performance metrics used in long-range decision-making — enrollment trends, retention and graduation rates, faculty productivity, tuition pricing, and financial aid structures. It reveals whether performance gaps are institution-specific or reflect sector-wide pressures, giving leadership a more accurate frame for responding.
- Stakeholders: Presidents, provosts, CFOs, board members
Aspirational Benchmarking
Benchmarking for the institution you want to become
Aspirational benchmarking compares the institution not to "who we are like" but to "who we want to become." This includes transitions from R2 to R1 classification, modeling future peer sets, and separating strategic peers from admissions peers. It is less about validating current performance and more about modeling institutional trajectory.
- Stakeholders: Executive leadership and trustees
Student Outcomes & Enrollment: The Most Frequently Benchmarked Category
If there is one benchmarking domain every IR office touches, it is student outcomes. Retention rates, graduation rates, admissions funnel performance, and disaggregated student success came up in virtually every interview — tied directly to institutional revenue, board reporting requirements, and strategic plan goals. This isn't surprising: student outcomes are both measurable and consequential in ways that make external comparison unavoidable.
Retention & Graduation Rates
The benchmark leadership reaches for first
Fall-to-fall and fall-to-spring retention comparisons against peer institutions dominate this category. Graduation rate benchmarking spans multiple timepoints — three-year, four-year, six-year — often disaggregated by population subgroup.
- Special program retention (student-athletes, Pell recipients, first-generation students) frequently tracked separately
Admissions Funnel Performance
Applications, yields, and competitive positioning
IR teams track applications, admits, and yield rates against peer institutions to understand competitive positioning in the admissions market. Conversion rate comparisons and enrollment modeling for new full-time students support both recruitment strategy and financial planning.
Disaggregated Student Success
Equity gap identification and intervention targeting
Performance metrics for Pell Grant recipients, minority students, first-generation students, and other equity-relevant populations are routinely benchmarked to identify institutional gaps versus sector norms. This data often feeds directly into strategic equity plans and accreditation narratives.
“"We do a lot of retention grade comparisons, those type of things for those groups of students to see how they're doing." — Data and Reporting Specialist, Wisconsin”
Why This Category Dominates
Three structural drivers explain why student outcomes benchmarking is universal. First, enrollment and retention have direct financial consequences — they are the institution's revenue model made visible in data. Second, board-level reporting consistently demands student success metrics benchmarked against peers, creating a recurring pull on IR capacity. Third, most institutional strategic plans include retention and graduation goals that require comparative context to evaluate meaningfully. IR teams don't choose to benchmark this category — they're required to by the structure of institutional accountability.
Faculty & Instructional Metrics
The second most common benchmarking area is faculty productivity and staffing. The driving question IR professionals return to repeatedly is what they call "right-sizing": determining what an appropriate faculty cadre looks like for a given enrollment size, program mix, and available budget. This question appears at budget cycles, departmental restructuring discussions, and anytime a dean or provost is making a case for or against a faculty hire.
“"Trying to figure out what right sizing is. So in this case, what should that faculty cadre look like?" — Director of Institutional Research and Analytics, North Carolina”
Faculty Compensation
AAUP data as the standard reference
The American Association of University Professors (AAUP) dataset is the primary source for faculty salary benchmarking. IR teams pull rank-based comparisons — assistant professor versus associate professor versus full professor — to support salary setting, retention conversations, and equity reviews.
Instructional Productivity & Right-Sizing
What is the right faculty headcount for our enrollment?
Student credit hours generated per faculty FTE, faculty cadre size comparisons, and compensation benchmarking are used together to justify allocation decisions. Right-sizing in this context means strategic restructuring aligned with long-term enrollment trends, institutional mission, and financial sustainability — not simply cutting headcount.
Leadership Use Case
Budget modeling and departmental restructuring
Faculty benchmarking is rarely purely academic. It is typically tied to a specific leadership decision: whether to request a new faculty line, whether to restructure a department, or whether compensation levels are competitive enough to retain key faculty. The IR team provides the comparative context that makes these decisions defensible.
Strategic & Operational Policy Benchmarking
Not all benchmarking emerges from strategic planning. IR teams regularly field one-off requests — quick operational comparisons that feed directly into administrative policy decisions otherwise made without comparative context. These requests can seem mundane: how many commencement ceremonies do peer institutions hold, or what parking tier structures do comparable schools use? But they matter to the administrators making those decisions and they land in the IR inbox. And they add up: in our whitepaper, ad-hoc requests like these consumed 40-60% of total team capacity.
- Operational Logistics: Parking tiers, freshman car policies, number of commencement ceremonies, housing policies
- Tuition & Affordability: Tuition pricing, net tuition revenue, financial aid discount rates compared to peers
- Institutional Trajectory Tracking: Movement toward R1 status, doctoral degrees conferred, research expenditures tracked over time
“"Thinking into the future every five years to say who do we think we're going to become in 5 years? And is that changing? Do we want to set a trajectory for R1 status? What does that look like?"”
Program Development & Workforce Alignment
Benchmarking also plays a central role when institutions are evaluating new academic programs. Before proposing a new degree, IR teams examine whether peer institutions offer the program, what enrollments look like at those institutions, and whether regional labor market demand justifies the investment. This work supports feasibility studies, curriculum committee reviews, and accreditation proposals — and it increasingly relies on labor market data tools alongside traditional peer comparison sources.
- Peer Program Enrollment: Which peers offer the degree, enrollment sizes in specific majors, program outcomes data
- Labor Market Demand: Use of tools like Lightcast to align proposed programs with regional job postings and workforce needs
- This benchmarking supports feasibility studies, curriculum committee reviews, and accreditation proposals
“"I need to do an environmental scan for this new program. Where I look at other schools that have similar programs. What's their enrollments look like, what's their graduates look like."”
Aspirational Benchmarking: Benchmarking for the Institution You Want to Become
A distinct pattern emerged from the interviews that is worth naming separately: benchmarking not against "who we are like," but against "who we want to become." Rather than comparing to current Carnegie classification peers, some IR teams are deliberately building peer lists around institutions they are targeting for future resemblance — separating strategic peers from admissions peers from research classification peers, and revisiting these lists on five-year cycles as institutional priorities evolve.
This aspirational orientation shifts the analytical frame. Instead of explaining current performance, benchmarking becomes a tool for modeling institutional trajectory — where the institution is headed, whether it is making progress, and what indicators signal meaningful movement toward its stated aspirations.
Defining the Aspirant Peer List
Five-year selection cycles and multi-category peer sets
Aspirational peer selection involves targeting R2-to-R1 transitions and categorizing peers into separate groups — strategic peers, admissions peers, and research classification peers — rather than relying on a single composite peer list. These lists are typically revisited on five-year cycles as the institution's strategic priorities evolve.
Strategic Indicators Used
Doctoral degrees, research expenditures, prestige markers
Aspirational benchmarking tracks doctoral degrees awarded, total enrollment size, research expenditures, and prestige markers associated with target classifications. These indicators serve as progress markers — evidence that the institution is moving toward its aspirational position rather than simply occupying its current one.
Deliverable Format for Leadership
Narrative insight over raw data tables
Executive leadership consuming aspirational benchmarking consistently prefers two-page summaries with narrative interpretation over raw comparative tables. The goal is capturing "the story behind the data" — not just reporting where the institution stands, but conveying what that position means and what it would take to close the gap.
Goal: Resiliency through insight, not just reporting.
Primary Benchmarking Data Sources
| Source | Primary Use | Key Benefit |
|---|---|---|
| IPEDS | Cross-institutional comparison | Standardized definitions covering ~10,000 institutions. Described as the "holy grail" — though "cleaning these files is the most overwhelming part of the job." |
| National Student Clearinghouse (NSC) | Competitive intelligence | Tracks where admitted students enroll instead, revealing competitive positioning in the admissions market. |
| NCCBP | Two-year institution benchmarking | Specialized metrics for community colleges not well-served by four-year benchmarking tools. |
| Academic Insights (U.S. News) | Ranking-related comparisons | Granular peer data for ranking analyses and prestige-oriented strategic planning. |
| AAUP | Faculty compensation | Rank-based salary comparisons that support equitable compensation and faculty retention decisions. |
| Lightcast | Program development | Labor market demand analysis aligned with regional job postings for new program feasibility. |
What Benchmarking Produces for Leadership
Across all these domains, benchmarking ultimately serves one function: it transforms institutional data into context that leadership can act on. Whether justifying a budget request, anchoring an accreditation narrative, explaining a retention gap to the board, or defining a five-year institutional trajectory — the IR team's role is interpretive. It is not just delivering data, but making it meaningful for the audience in the room.
That interpretive function is what distinguishes IR benchmarking from raw data retrieval. Anyone can pull an IPEDS table. What IR professionals provide is the framing that makes a number consequential: whether a gap is alarming or expected, whether a trend is institutional or sector-wide, whether an aspiration is realistic or needs recalibration.
Closing Insight
From 50 interviews, IR teams benchmark most consistently across four core domains — and the pattern holds regardless of institution size, type, or region.
- Student outcomes: Retention, graduation rates, admissions funnel performance, and disaggregated student success metrics
- Faculty metrics: Compensation, teaching loads, and instructional productivity relative to enrollment
- Strategic and operational policy: From parking logistics to tuition pricing to long-range institutional trajectory tracking
- Program viability: Peer program enrollment data and labor market demand analysis for new academic programs
There is an increasing focus on aspirational benchmarking — not just to compare current performance, but to define and track institutional trajectory. IR teams are moving from "how do we compare?" toward "how do we want to compare in five years, and what will it take to get there?"
All of this benchmarking work lands on lean teams: our whitepaper found that 50% of institutions run IR offices of just 1 to 3 people.
See How Clema Handles Benchmarking Requests
Clema helps IR teams surface peer comparisons, IPEDS data, and benchmarking context in minutes, so your team can focus on the interpretation that leadership needs, not the data wrangling.
Book a Demo